🍽 NYC Dining Safety Prediction (Data & ML System)
A data-driven machine learning project that predicts NYC restaurant health inspection grades (A / B / C) using public city data, demographic indicators, and historical inspection records.
The goal is to identify high-risk restaurants before inspections occur, enabling more proactive public health interventions. 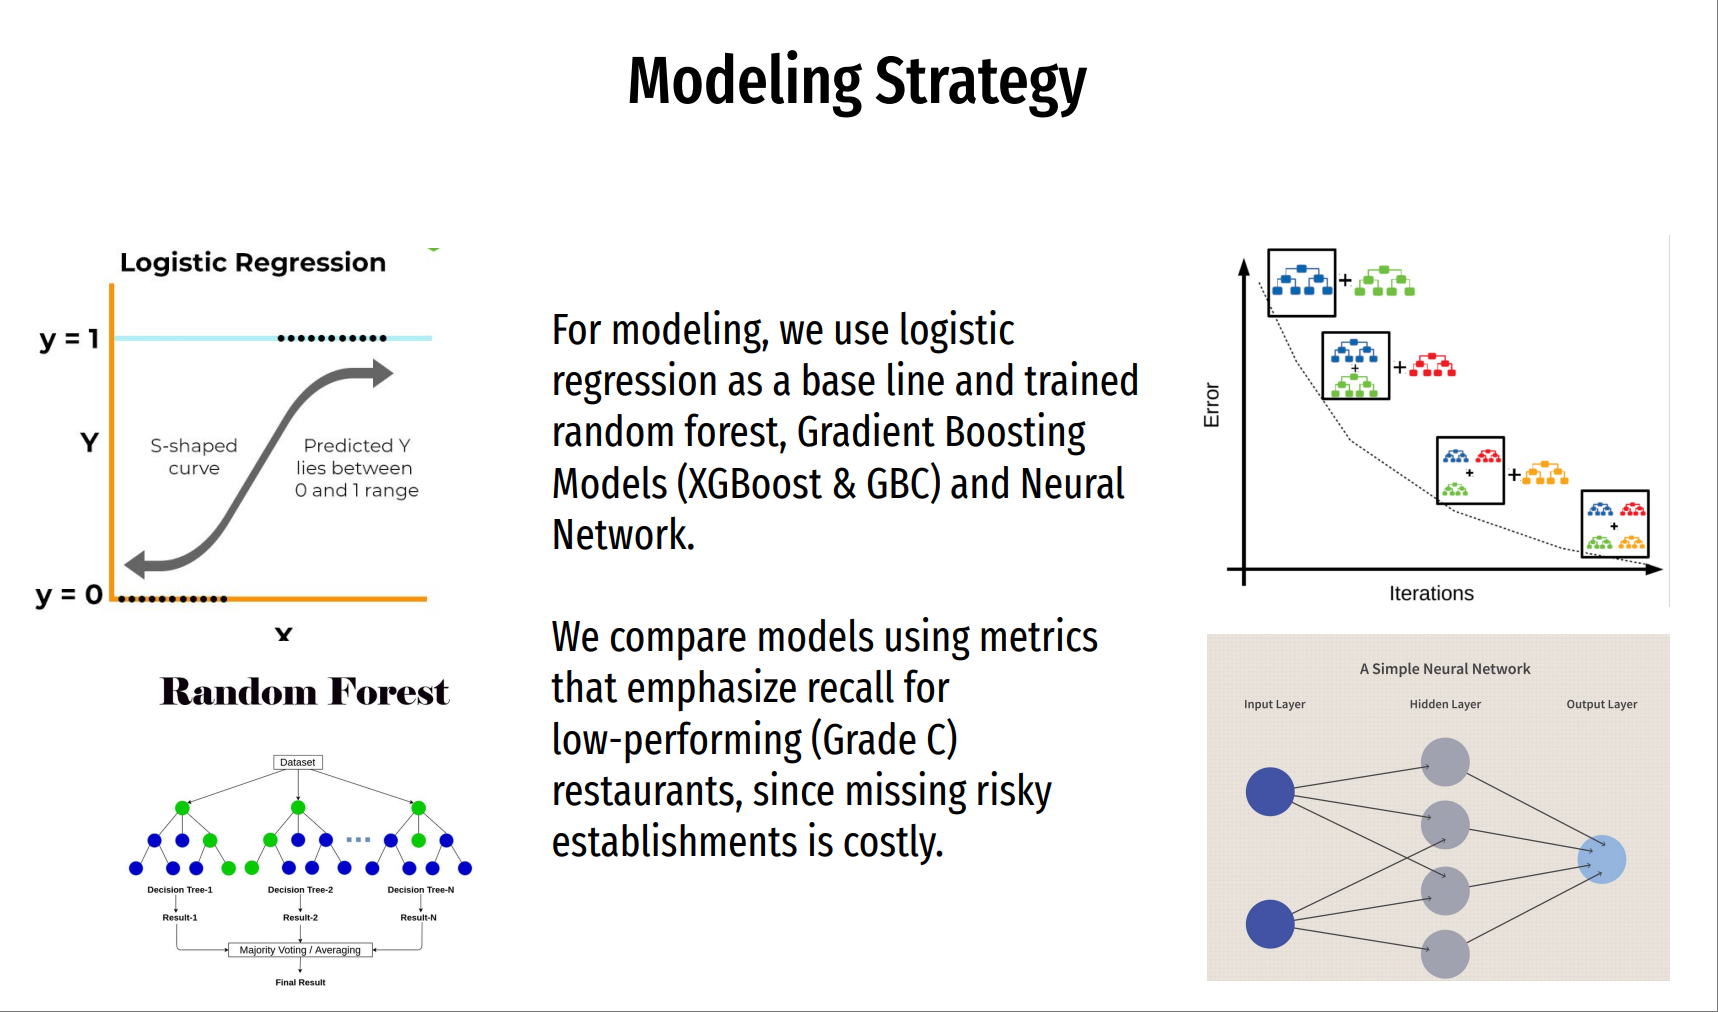
🎯 Project Overview
This project builds an end-to-end data science pipeline to predict restaurant inspection outcomes based on a combination of:
- Restaurant inspection history
- Neighborhood-level socioeconomic indicators
- NYC 311 complaint patterns
- Geographic and demographic context
The system is designed not just for prediction accuracy, but for policy-relevant decision making — specifically maximizing recall for Grade C (high-risk) restaurants, where missed cases are costly.
🎥 Demo & Presentation
- ▶️ YouTube Presentation
-
📦 GitHub Repository
👉 View on GitHub
🔧 Tech Stack
- Python
- pandas, NumPy
- scikit-learn
- XGBoost
- SQL-style feature aggregation
- Data visualization (matplotlib / seaborn)
📊 Data Sources
-
DOHMH NYC Restaurant Inspection Results
Historical inspection grades and violation records -
NYC 311 Service Requests
Non-emergency complaints (noise, sanitation, heat/hot water, etc.) -
NYC Census Data
Population demographics and neighborhood-level economic indicators
These datasets are joined and aggregated at the restaurant and geographic level to construct predictive features.
🧪 Feature Engineering & Preprocessing
Feature Selection
- Correlation analysis to identify redundant signals
- Mutual Information (MI) used to measure feature relevance
- Final numeric features include:
complaints_per_capitaincometotal_populationcensus_tractzipcode
Preprocessing Pipeline
- Train / test split (~97k training, ~24k testing)
- Standard scaling for numeric features
- One-hot encoding for categorical variables
- Label encoding for targets (A / B / C → 0 / 1 / 2)
⚖️ Handling Class Imbalance
The dataset exhibits strong class imbalance, with Grade C restaurants underrepresented.
To address this:
- SMOTE (Synthetic Minority Oversampling Technique) is applied
- Balances class distribution during training
- Enables models to better learn high-risk patterns
🤖 Modeling Strategy
Models evaluated include:
- Logistic Regression (baseline)
- Random Forest (tuned)
- Gradient Boosting (XGBoost, GBC)
- Neural Network (MLPClassifier)
Evaluation Focus
- Metrics emphasize recall for Grade C
- Goal: catch as many risky restaurants as possible, even at some precision cost
📈 Results Summary
- Tuned Random Forest outperformed other models
- Achieved approximately 80% recall for Grade C restaurants
- Consistently stronger than Logistic Regression, XGBoost, and Neural Networks
- Demonstrated robustness across macro F1 and recall-oriented metrics
🧠 Insights & Interpretation
Model interpretation reveals that neighborhood-level factors dominate prediction power:
- Income
- Complaints per capita
- Census tract
- Total population
This suggests that sanitation risk is not random, but clusters geographically and socioeconomically — an important insight for public health planning.
🚀 Future Directions
- Time-aware modeling to capture temporal trends
- NLP on violation text and 311 complaint descriptions
- Improved geographic modeling
- Probability calibration for policy use
- Integration into operational inspection workflows