🧠 Innocube: Intelligent Survey Analytics Platform
A full-stack data intelligence platform that transforms raw survey results into interactive analytics dashboards — powered by AI, data visualization, and automation.
🎯 Project Overview
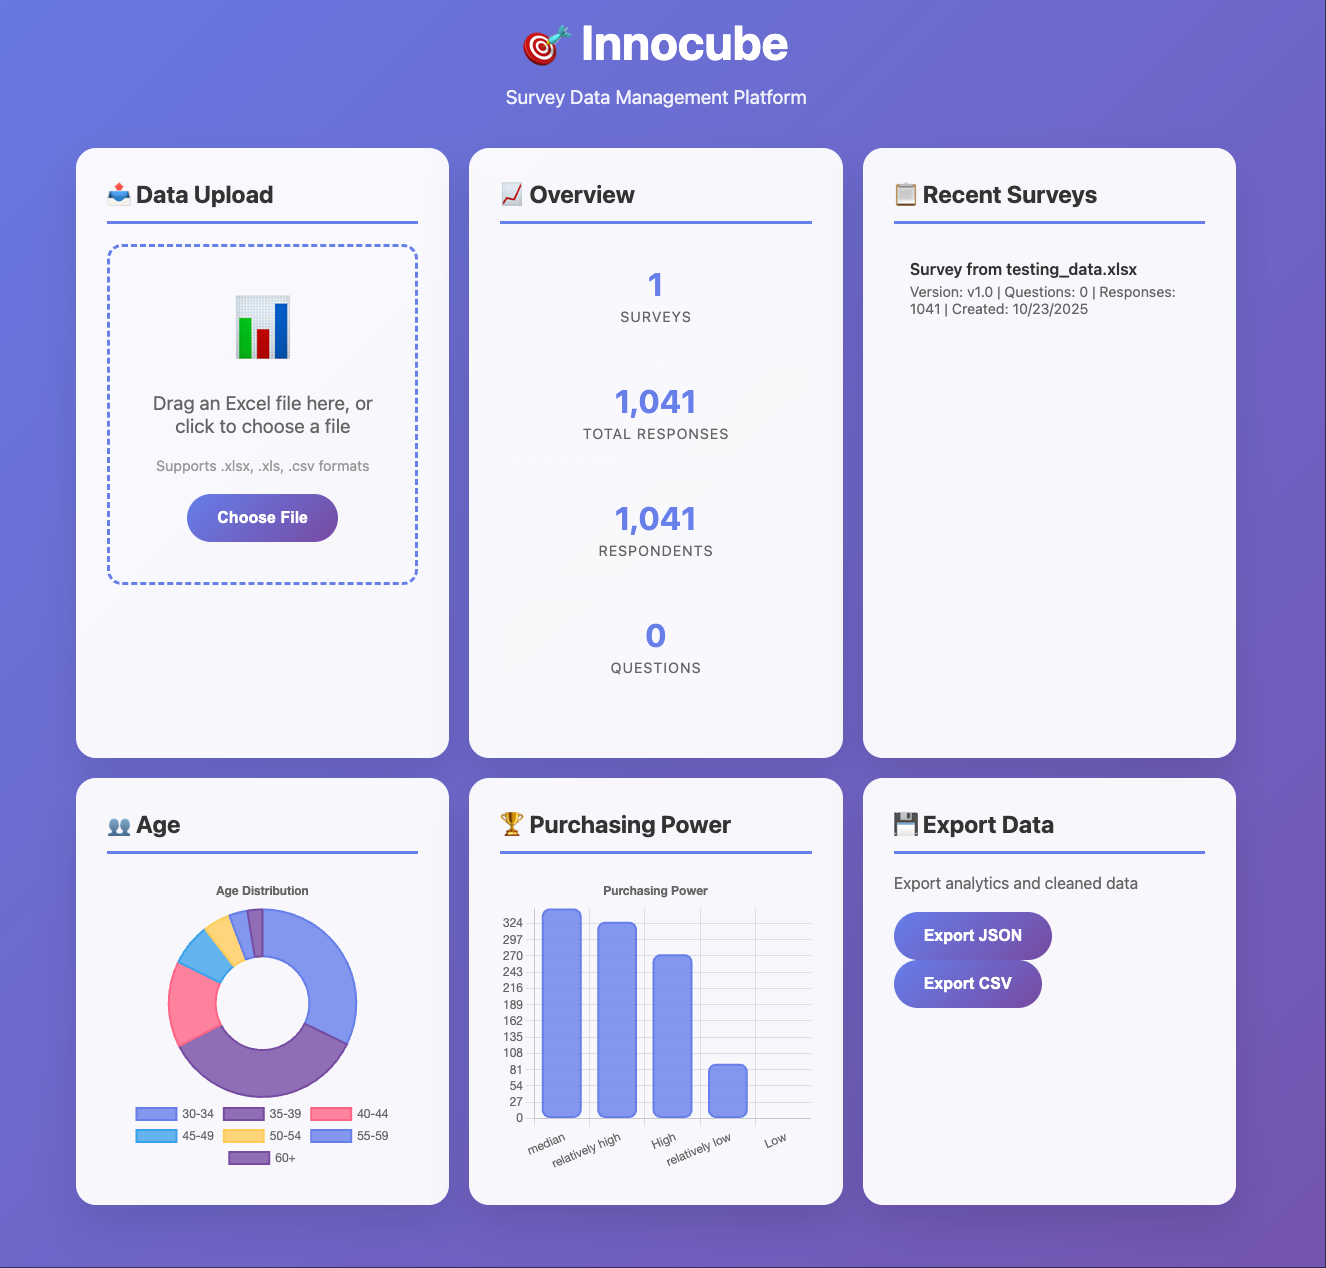
Innocube is a lightweight yet intelligent web application designed to analyze large-scale consumer survey data in real time.
It automatically cleans uploaded Excel files, extracts structured insights, and visualizes demographics, brand preference, and purchasing power distributions — all within an interactive dashboard.
The project combines data engineering, Flask-based back-end design, and modern web visualization, offering an end-to-end data analytics workflow.
🔧 Tech Stack
- Backend: Python (Flask, SQLAlchemy, Pandas)
- Frontend: HTML, JavaScript, Chart.js, Bootstrap
- Database: SQLite / PostgreSQL (containerized)
- Deployment: Docker, Docker Compose, Nginx (optional for production)
- Data Processing: Pandas + OpenPyXL for intelligent Excel ingestion
⚙️ Core Features
- Automated Data Parsing: Upload raw survey Excel sheets; the app auto-detects demographic, location, and purchasing power fields.
- Dynamic Dashboard: Real-time visualizations of age, gender, and purchasing power distributions.
- Smart Data Cleaning: Handles mixed-language column names, missing values, and inconsistent data formats.
- Modular API Architecture: RESTful endpoints for analytics, survey management, and data export.
- Seamless Extensibility: Easy integration with cloud databases or BI dashboards (e.g., Power BI, Tableau).
💡 System Architecture
The system follows a Model-View-Controller (MVC) architecture:
- Model: SQLAlchemy ORM managing surveys, respondents, and analytics results
- View: Responsive web UI with real-time Chart.js rendering
- Controller: Flask routes handling uploads, parsing, and analytics computation
📈 Data Intelligence
Innocube’s analytics engine automatically:
- Generates demographic breakdowns (Age, Gender, Region)
- Aggregates purchasing power segments into actionable visual insights
- Supports future extensions like AI-driven clustering, sentiment analysis, and predictive modeling
🧪 Testing & Validation
- Verified across multiple Excel formats (
.xlsx,.csv) - Robust handling of 100K+ record datasets
- Unit testing for upload endpoints, schema validation, and aggregation logic
🔗 GitHub Repository
Explore the full implementation and documentation on GitHub:
👉 View on GitHub
🎥 Demo Video
Watch the demo walkthrough of Innocube’s intelligent analytics dashboard:
🌟 Impact
Innocube streamlines consumer insight analysis by reducing manual Excel processing time from hours to minutes.
It bridges the gap between raw data and strategic decision-making, making it ideal for research teams, marketing analysts, and data-driven organizations.